Quality control and filtering
After importing genotype data, it is often useful to see a few basic statistics to ensure the data has the quality that you expect. HaploTool allows you to perform the following common quality checks:
- For markers:
- Allele frequency distribution
- Missing calls distribution
- Proportion of heterozygous calls per marker
- For samples:
- Distribution of missing calls per sample
- Proportion of heterozygous calls per sample
After seeing the distribution, the user can set the thresholds for filter parameters (MAF, missing rate, heterozygosity) and save a filtered dataset. The details are given below.
Marker QC and filtering
To perform marker-based filtering, select “Filter” in navbar and click on “Markers” tab on the main page.
A first step is to select some reasonable options for acceptable marker quality (if not selected, the defaults will be used), and click on Preview filtering button to see both the distributions of basic statistics and the selected thresholds.
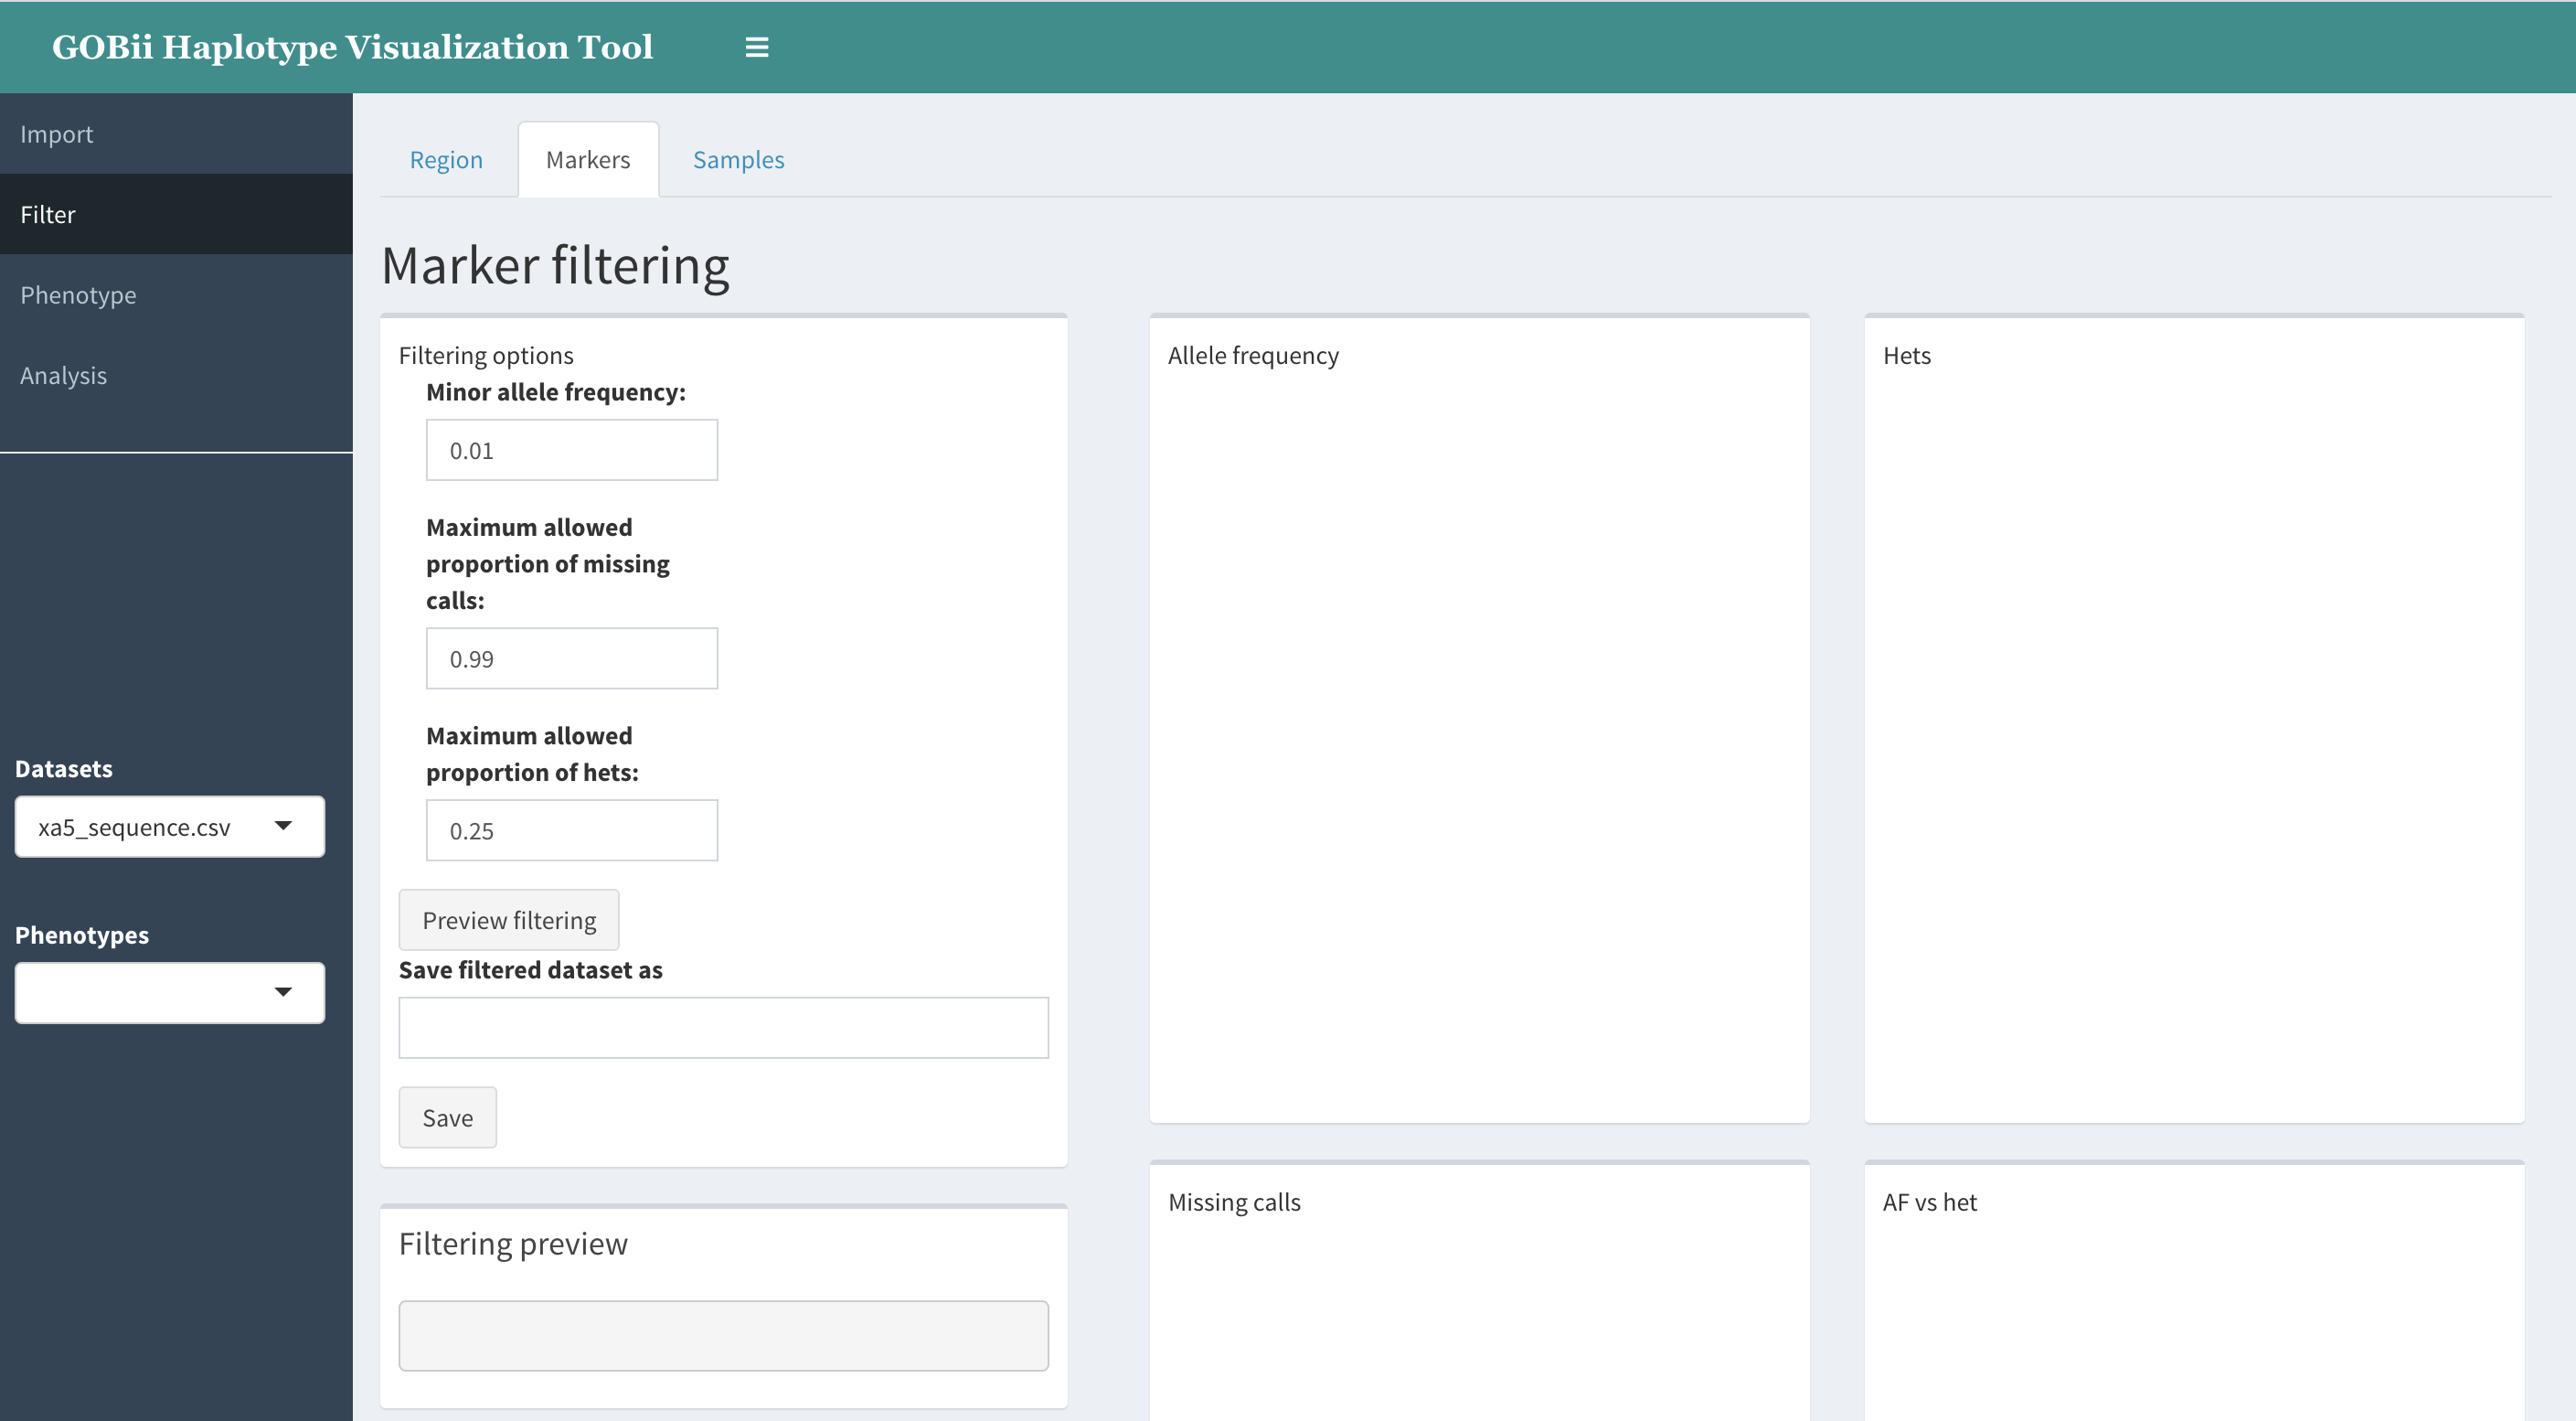
Upon clicking Preview filtering, the following graphs are created:
- Allele frequency distribution.
This will show distribution of frequencies of non-reference alleles. Here by frequency of ALT allele we mean the ratio of number of chromosomes carrying ALT allele to the total number of chromosomes with non-missing variant calls. A vertical line at the selected MAF threshold value will be shown.
- “Hets” - proportion of heterozygous calls per SNP.
For each SNP we compute the proportion of heterozygous calls among all non-missing calls, and show a histogram of these values.
- Missing calls - proportion of missing calls per SNP.
- “AF vs hets”. A scatterplot of allele frequency vs. proportion of hets.
This graph allows one to judge about the level of heterozygosity for different values of allele frequency, thus enabling to visually estimate the levels of inbreeding (deviations from HWE).
Along with the graphs, the text area “Filtering preview” will show how many markers remain if filtering is done with given parameters.
If you need to adjust the filtering thresholds, please make the necessary changes and click Preview filtering again.
Once the filtering is satisfactory, enter a name for the filtered dataset and click Save.
The newly created dataset will be placed at the top of “Datasets” dropdown list in the navbar and will become the active dataset.
Sample QC and filtering
Sample QC is done in the same way as marker QC.
The following statistics are visualized:
- Missing calls per sample
- Proportion of heterozygous variants among all non-missing variants in a sample.
Click on Preview to view the distributions of hets and missing calls per sample, along with vertical lines showing the selected thresholds.
After Preview filtering, click on Save to add the filtered dataset into the dataset list.
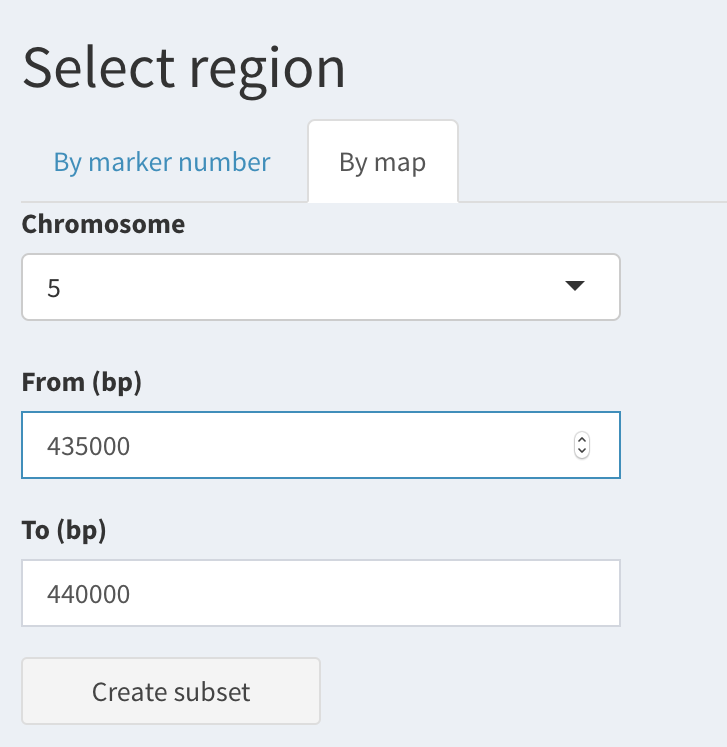
Region-based filtering
You can create a subset of your genotype data that contains markers from a specific genomic region.
The region can be specified as follows:
By physical position:
Fill in the “Chromosome”, “From”, “To” text boxes in the “By map” tab.
By numeric range of markers:
Select “By marker number” tab, then enter “From marker no.” and “To marker no.” ).
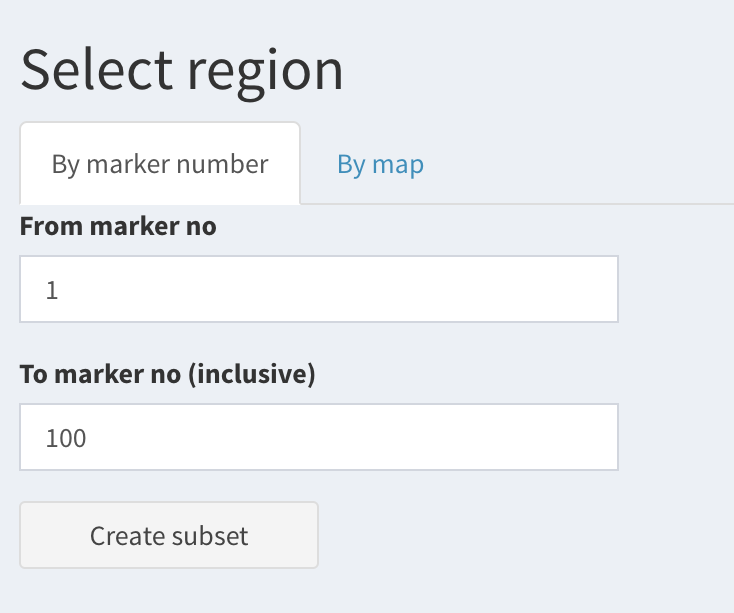
Click Create subset to add the selected subset to the dataset list.
The subset will contain all samples from the original dataset, only markers will be affected.